
As you might have gathered from reading some of our recent posts, we enjoy gathering and analyzing data- especially when this data regards the costs of our recent RTW adventure.
We kept detailed budget information on all of the places that we visited, in part to see how much we actually spent in total for our 10 months of travel, but also to look at the information broken down by country. We recently wrote about how much we spent in total and were excited that we had managed to keep under our goal of spending less than $100/day on the trip.
But for those of us who are really curious about data, or those who might be considering trips to some of the countries we visited, we have a bit more information!
We visited a total of 29 countries on our RTW trip, but for various reasons, we kept a budget breakdown by country of only 17 of them (as well as a budget for our whole self-drive safari in southern Africa). Some of the reasons we didn’t include a country might be: we visited for only a day so the data isn’t that valid or interesting (Egypt, Zimbabwe, Germany, Macau), we visited with our parents and they either changed our mode of travel significantly or paid for a significant portion of the trip so we felt like the data would not accurately represent what we did there (Czech Republic, Slovenia, Croatia, Bosnia Herzegovina), we visited friends/family/relatives at home (USA), or our activities ended up being so strange and out of the ordinary that they don’t represent a normal trip to the country (Nepal). We also kept our budget for our self-drive safari as a whole rather than separate the countries we visited (Botswana, Namibia).
We took the data that we were keeping which was in categories for spending (Accommodation, Activities, Alcohol, Food, Miscellaneous, Transport, and Visas) and divided each of those out by day to get some idea of which countries were expensive in which categories.
Here are the countries we have full data on in alphabetical order.

As you can see: 17 countries plus our self-drive safari were looked at. They cover three continents: Africa, Europe, and Asia.
We kept a record of how many days we were in each country.
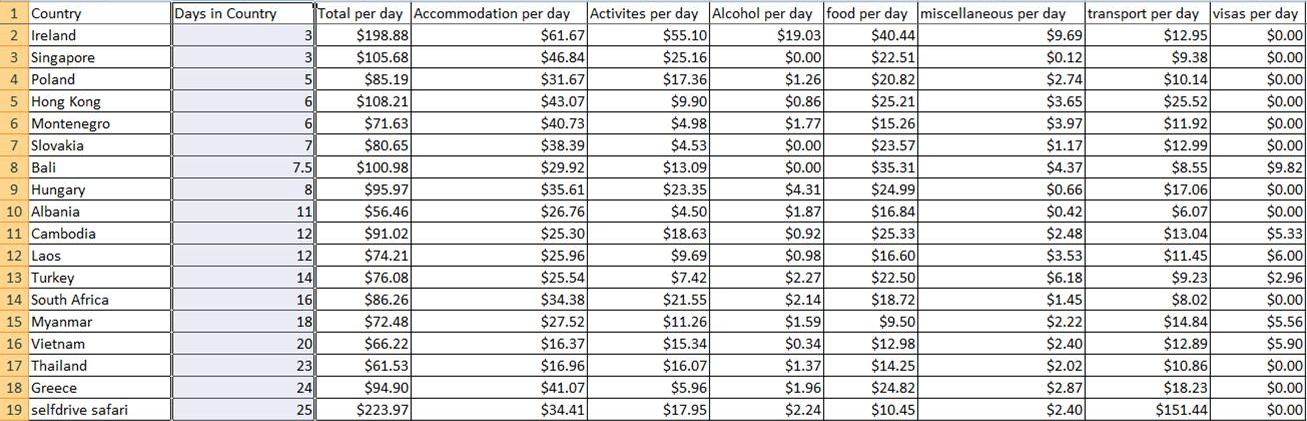
The shortest amounts of time were in countries that we managed to plan last minute layovers in on our way somewhere else (Ireland and Singapore). We actually are a little regretful that we didn’t spent more time in Poland. As it was, we only crossed the southwestern corner and visited only one city there. Krakow was great and it whet our appetite to see much more of Poland. Hong Kong is small so we spent a short time there, but we ended up wishing we had more! The longest visits were in the places that were farthest away, places where we felt a return trip was slightly less likely. Our self-drive safari took us to 4 countries and was the longest period of time where we did one activity on the entire trip.
Average Accommodation Costs Per Day

Our cheapest accommodations were, unsurprisingly, in southeast Asia. The surprise there is that Turkey was so affordable. The great thing about all of those is that we also got nicer accommodation in all those places than in some of the others. We almost never stayed in a dorm in SE Asia for example, whereas, our most expensive nights were in Ireland where we rented just one room in someone’s home. Singapore and Hong Kong both were high and both of those rooms were small and relatively uncomfortable. The self-drive safari were all campsites (!) yet this ranks on the more expensive half of our accommodations. Strange.
Average Activities Costs Per Day
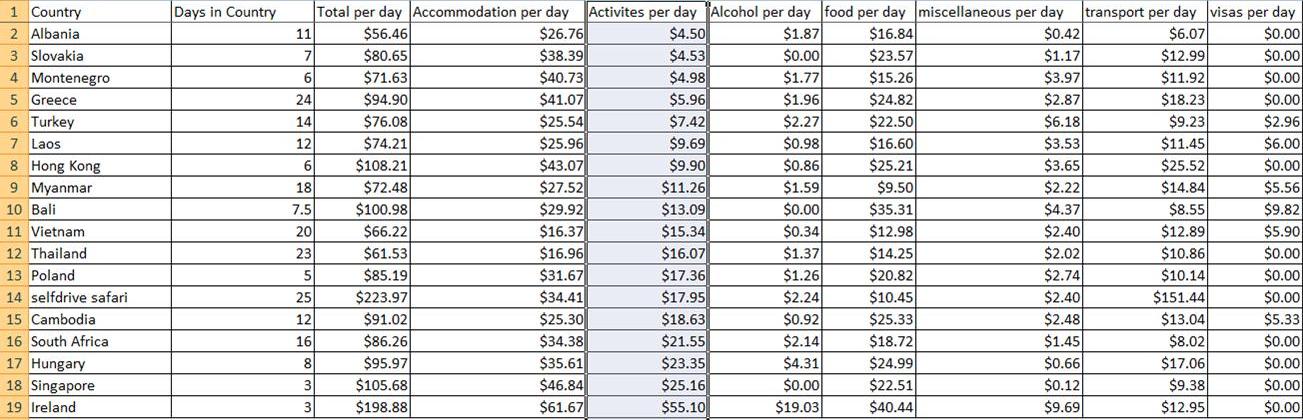
This is, no doubt, a difficult one to compare. Activities costs depend largely on time of year, length of stay, and interests. Montenegro was low, for example, because we didn’t do a lot while we were there. We took a week to calm down and relax, mostly walking and people watching. Vietnam and Thailand rank more expensive on this list, but that is in part because the cost of activities were so low there, that we chose to do more! For example, we took many day tours in both those places: days with elephants, cooking classes, cave tours, guided excursions, etc. We did none of those things in Albania, choosing more “do it ourselves” activities. However, this does give you a decent representation of activity costs. Ireland and Singapore were very high and that shows!
Average Food Costs Per Day

Our lowest costs here were in SE Asia again – with the weird standout being Cambodia. We’re not sure what to say about that except that it was the beginning of our experience with hot, humid SE Asia. We weren’t tough yet and looked for places with indoor seating and AC which undoubtedly increased our costs. Bali ranks high because we traveled with some friends who really enjoy food! Our self-drive safari comes in low (for the first time) because we did all of our cooking for ourselves. The same can be said of Montenegro, which also comes in pretty cheap. For our entire week there, we only ate out once. Interestingly though, Vietnam and Thailand come in very cheap and we ate out for almost every meal there! They both are excellent places to be if you enjoy eating! Ireland was just plain pricey!
Average Transportation Costs Per Day

Not surprisingly, our self-drive safari comes in the most expensive here with the cost of renting our safari truck and paying for gas. It is frustrating to see Greece come in so high, especially because the transportation there ended up being so unreliable. Albania was a true winner in this area – easy transport (though not super comfortable) and very cheap prices.
So… What were the most and least expensive places?! Let’s find out!
Average Total Cost Per Day
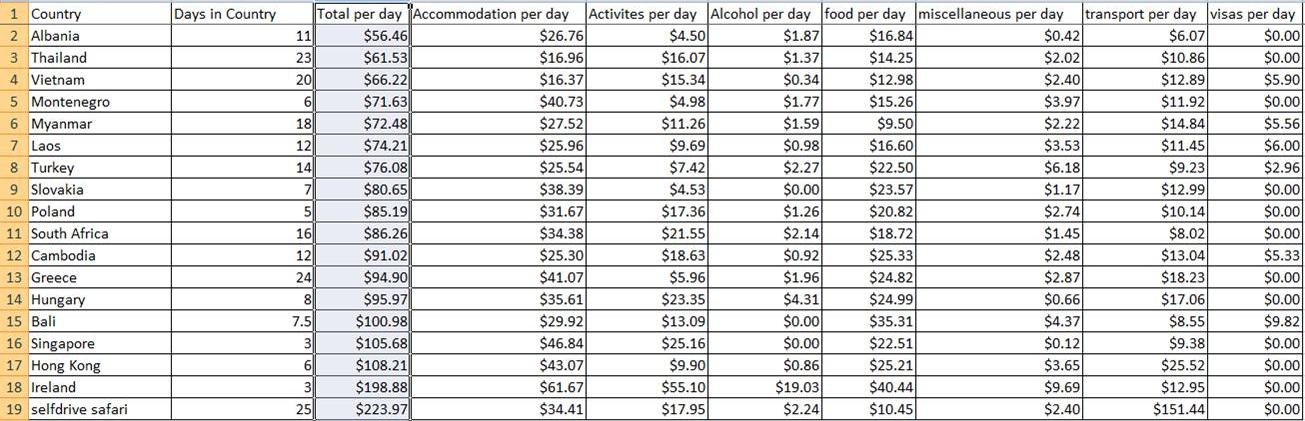
Our cheapest country was Albania! Who would have thought that the least expensive place to travel would have been somewhere in Europe? The most expensive by far was our self-drive safari. This also seems a bit of a surprise because we were driving ourselves and staying in campsites along the way. Other things we noticed which muddle the data: We tended to spend more in places were we spent the least amount of time (see Ireland, Hong Kong, and Singapore). We think we felt the pressure to cram the same amount of things in but had to do it in a hurry. This definitely caused higher average per day costs.
There you have it! Check out our activities in each country to get a better idea of how this data might relate to you and your travel style.

Again, thank you for the detailed record keeping! We set out in a couple of weeks for our (family of six )year of travel. I don’t think I can be as organized in collecting expense data, but I am very grateful for yours!!
[…] posts about our RTW stats, including things like our budget, our most expensive and least expensive locations, and our favorite things in many categories. But, one thing was missing – a round up of our […]